Existing Biotic and Abiotic Influences
Biotic and abiotic influences exist impacting agricultural growth within an area.
Abiotic influences include salinity levels, lower
temperatures, natural disasters and low availabilities of water, while biotic influences involve
pathogens, parasites and insects (See Figure 2). When suffering from these influences, crops prioritize
survival over growth. This is especially true of pathogens, as viruses cause
annual yield losses of potato and sugar beet. Insect and pest attacks attributed
to 20% of yield losses in the major crops worldwide, so is clearly a major limitation on achieving food security for the future.
Climate change has heavily influenced the existing abiotic limitations on food security. Increasing greenhouse gas levels have resulted in an increase in the severity and frequency of extreme weather events (Figure 3), all of which can affect agricultural practices, limiting the world's capabilities of achieving food security. Overly heavy rainfall can drown crops, while an increase in droughts makes it more difficult to hydrate plants and keep them alive.
Climate change has heavily influenced the existing abiotic limitations on food security. Increasing greenhouse gas levels have resulted in an increase in the severity and frequency of extreme weather events (Figure 3), all of which can affect agricultural practices, limiting the world's capabilities of achieving food security. Overly heavy rainfall can drown crops, while an increase in droughts makes it more difficult to hydrate plants and keep them alive.
Figure 2: Virus infected plant.
Source: Jiskani, M. M.
(2911, November 19). Agrihunt. Retrieved from Viral Diseases of Economic
Crops.
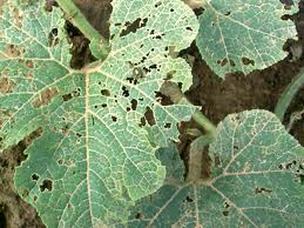
This plant has been affected by a virus which has caused significant cellular damage in the leaves. Viruses can attack and affect plants in a variety of ways, most of which are fatal, and some of these viruses can affect humans if the infected plant is consumed. Producers must therefore control and eliminate viral infections in plantations, as infected plants can become inedible.
Figure 3: Number of exe 1900-2000 worldwide.
Source: UC Santa Barbara
Department of Geography. (2010, August 14). Global Warming. Retrieved
October 2013, from UC Santa Barbara Department of Geography:
http://www.geog.ucsb.edu/events/department-news/753/global-weirding/
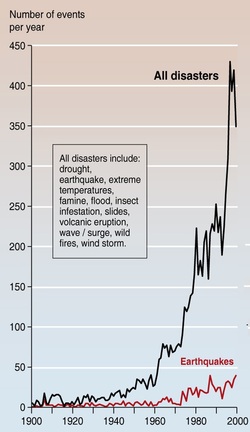
Figure 3 is a line graph depicting the number of extreme events that have occured eper year, inciluding drought, earquake, extreme temperatures, famine, flood, insect infestation, slides, volcanic eruption, wave/surge, wild fires and wind storms, all of which can affect agricultural practices and food production. Although significant improvements in information access, allowing people to be more aware of the number of events, as well population growth, increasing the possibility of people being affected by and reporting extreme events have definitely affected this data depicted on this graph, it is still very clear that there has been a definite rise in the number of extreme events per year. Close to the year 2000, tthe number of events reached a peak of about 430 events, equivalent to more than 1 event a day. Despite events such as insect infestations, famine, slides and volcanic eruptions, which are not heavily affected by climate change being included, the data represented on this grph is still useful as it highlights just how much of a limitation extreme events in general can become in the future.
